Changelogs
Stay up to date with the latest changes and enhancements.
Stay up to date with the latest changes and enhancements.

10. Nov 2025
Share
We're excited to announce a major update to advanced analytics on Chariow. This big upgrade will help you better understand your activity and make smarter decisions based on your data.
This new version of analytics turns your dashboard into a real strategic command center.
Now you can see in real time what's happening on your store, figure out what works, and tweak what needs tweaking—all without leaving Chariow.
The advanced analytics bring together all your key data in a clear, intuitive interface:
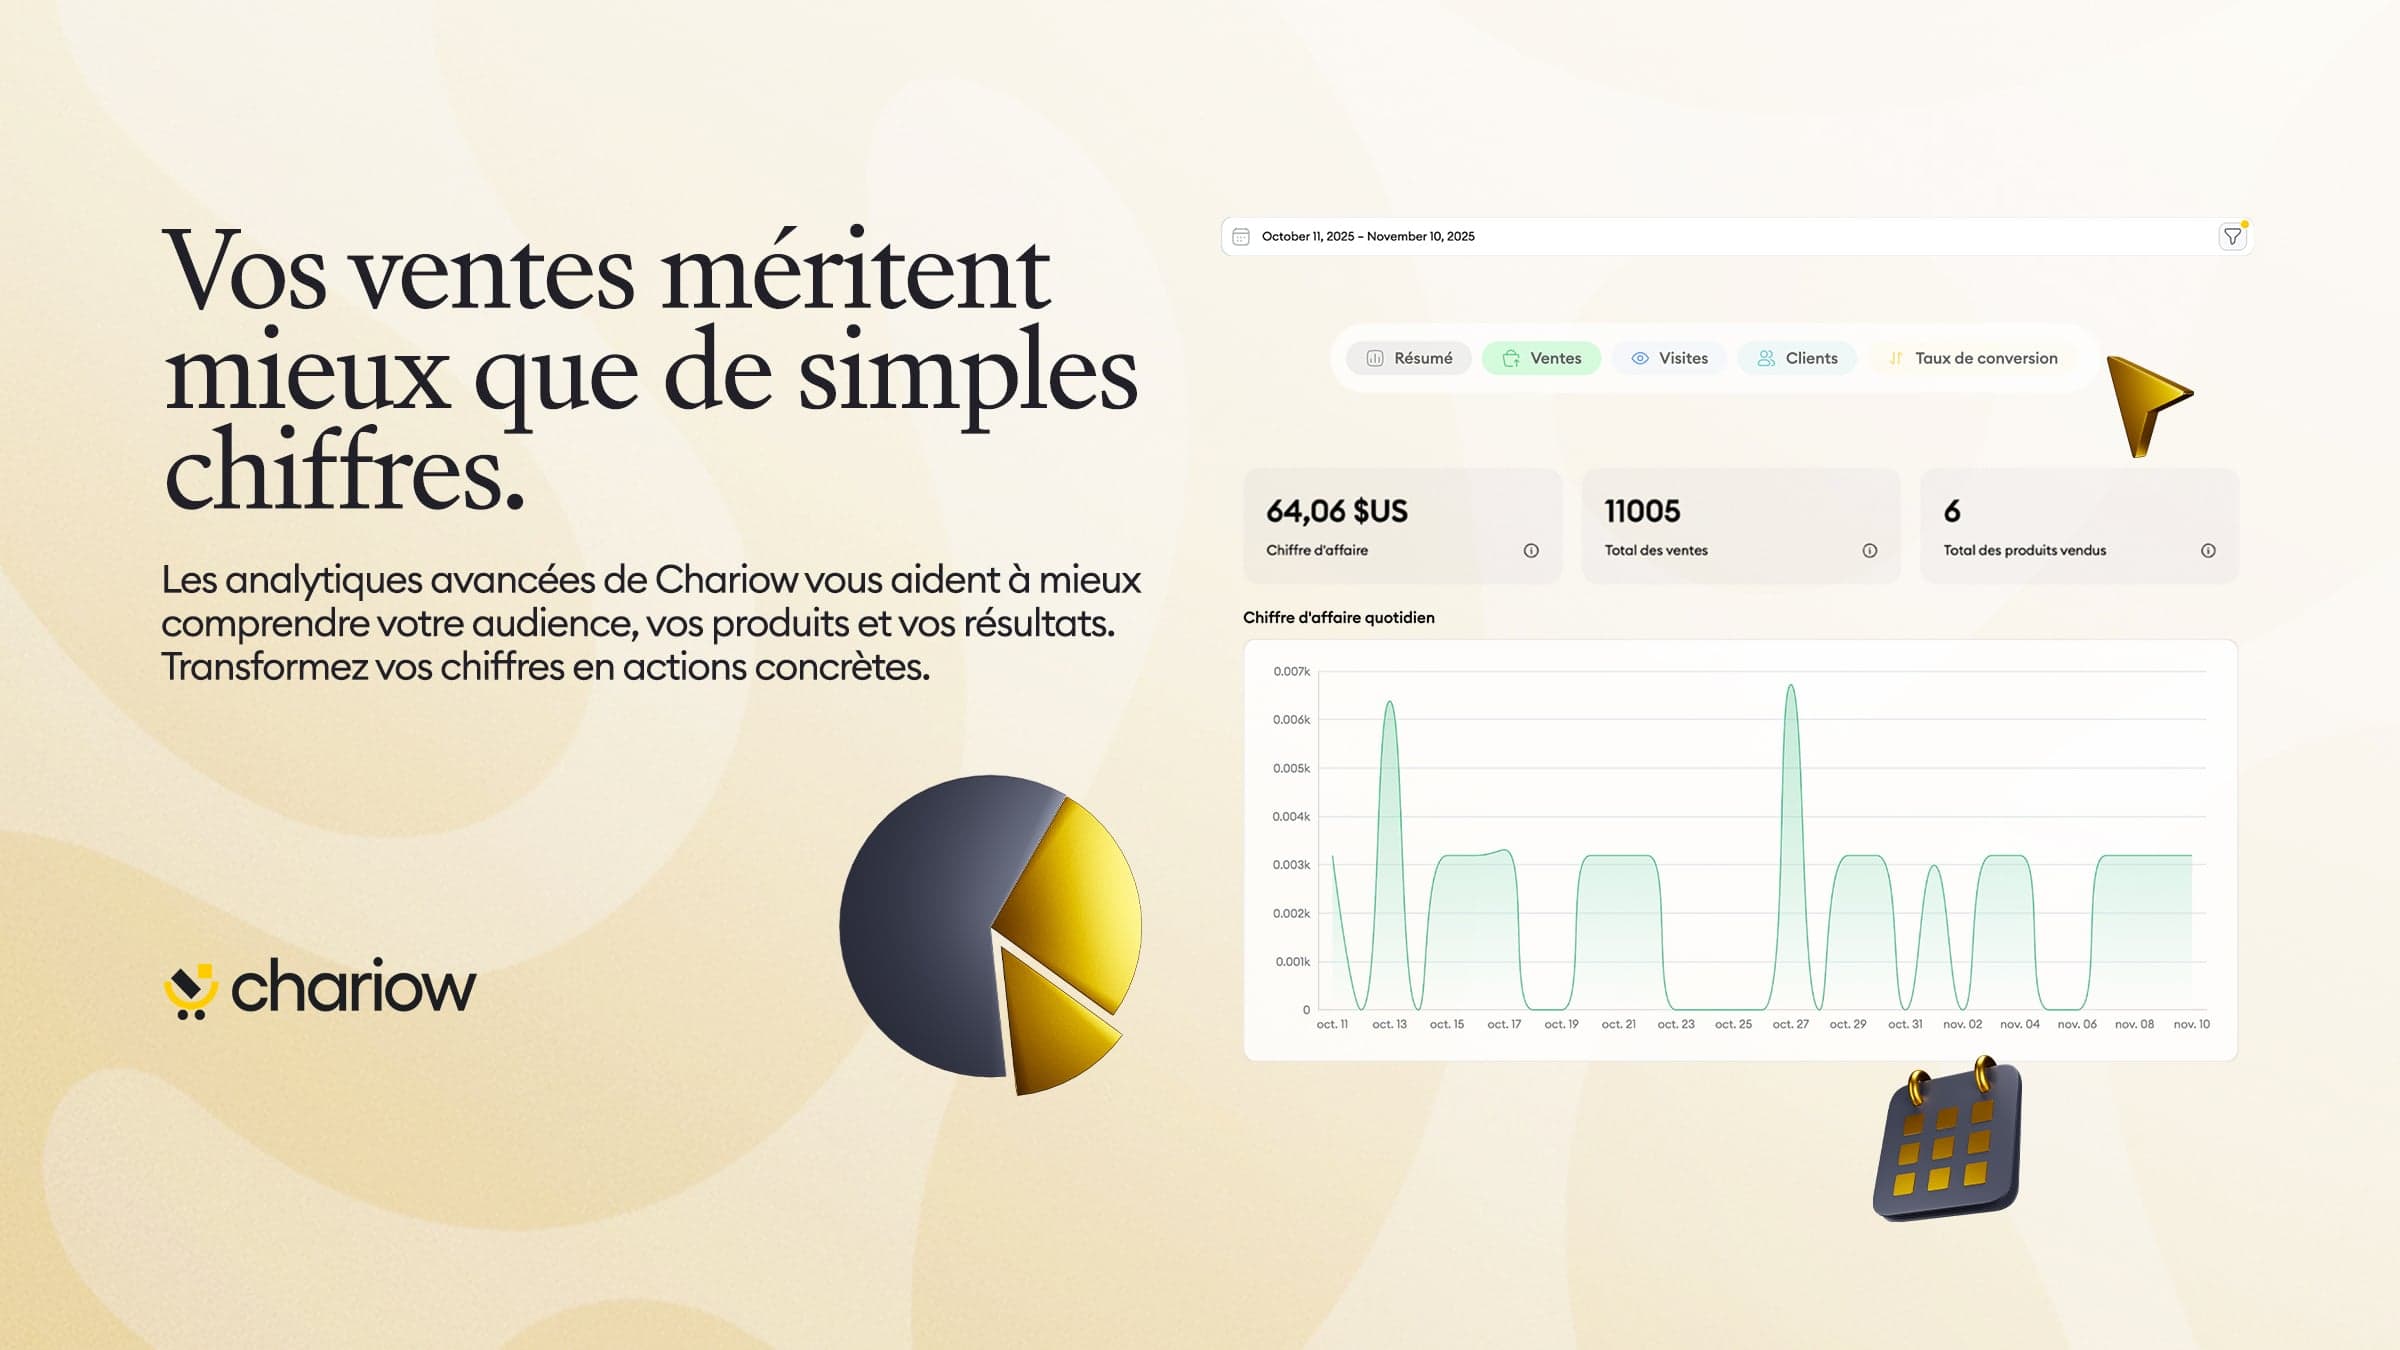
1. Summary: Your instant overview.
Track your revenue, total sales, conversion rate, and abandoned carts.
The daily chart shows you exactly how your performance is trending.
2. Sales: Understand where your revenue comes from.
See your total revenue, average cart value, number of products sold, and your sales trends. Find your top-performing products and your best sales periods.
3. Visits: Dive deep into your traffic.
Find out how many people visit your store each day, where they’re from (by country), and which device they browse on (mobile, desktop, tablet).
4. Customers: Get to know your audience better.
How many customers are new? How many are coming back? This data helps you tweak your offers and improve retention.
5. Conversion rate: Optimize where it matters.
See your overall rate, then break it down by country and device to understand where you’re losing visitors and where to focus your marketing efforts.
You can refine your analysis according to three criteria:
By campaign: measure the impact of each of your marketing actions.
By product: find out what brings the most traffic, sales, and revenue.
By discount code: assess how effective your promos really are.
Combine these filters with the date selector to get an accurate read on your results and instantly see what’s influencing your sales.
Before this update, you could sell without really knowing who was buying, why, or where your sales came from.
Now, everything’s clear.
You can:
Identify your most profitable products.
Know exactly where your customers come from (Benin, France, USA, Canada…).
Understand why some campaigns work better than others.
Spot the weak points in your sales funnel (mobile, country, products).
Make decisions based on real data, not guesses.
Imagine you're selling an online course. Your stats show:
160 visits this month
95 visits come from the United States
110 visits are on Desktop
Conversion rate: 0%
You dig deeper:
Filter by product: your French course is getting a lot of US visits
Filter by device: Desktop has good engagement but 0 conversions
You get it: The US market is interested but doesn’t get your content in French.
You take action: You translate your product pages into English.
Result in 2 weeks: US conversion rate: 0% → 7%. First international sales.
That’s the power of advanced stats.
Advanced analytics are available for free for all Chariow users starting now.
No need for Google Analytics anymore. No more juggling between multiple tools. Everything is directly integrated into your Chariow dashboard.
Filter by period, by campaign, by product, or by promo code.
See things in real time. Understand your data in a few seconds.
Watch the full video to see how to navigate each module and make the most out of your data.
Analyze your data, make the right decisions and optimize what really matters.
The Chariow team